Hellenic Exchanges (EXAE GA, OW, TP EUR6.4)
-
Attractive risk reward profile as current stock price implies daily trading turnover of EUR27m (62% below EUR71m y-t-d); HELEX is a good proxy through which to play a potential rebound in Greek equities
-
Strong EUR149m end-2015e net cash position (56% of mkt cap) leaves plenty of scope for extra cash returns; we see total yields of 6.2-10.6% over 2015e-17e; HELEX trades 10.0x 2016e ex-cash PE and 6.3x
-
We raise TP to EUR6.4 (EUR6.2) as we rollover our DCF model 1-year forward, suggesting 58% potential upside; OW rating reiterated
Why we like HELEX?
Thanks to its high beta nature and low risk profile, HELEX is a good proxy through which to play a potential stronger appetite for Greek equities, we believe.
End-2015e net cash position of EUR149m (56% of market cap) offers ample potential for future cash returns. That said, we look for total yields of 6.2% (EUR0.25), 8.9% (EUR0.36) and 10.6% (EUR0.43) in FY 2015e-17e, respectively.
Adjusting for cash rich position, HELEX trades 10.0x 2016e PE (6.3x EV/EBITDA) at significant discounts vs peer group.
We also like HELEX for its strong ability to create value internally, debt-free balance sheet and minimal capex requirements.
Key catalyst
A surge in trading activity, as progress in Greece's public finances becomes evident, should boost HELEX earnings, acting as key performance catalyst.
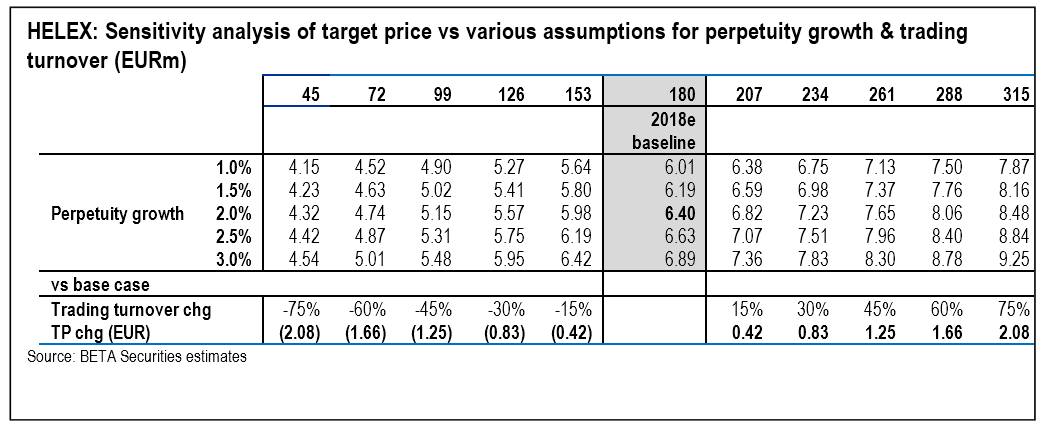
Our sensitivity analysis implies that each 15% increase (+EUR27m) in our 2018e ADT base scenario of EUR180m would add EUR0.42 per share to our TP.
Valuation
We value HELEX using a 2-stage DFC model with explicit forecast to 2018, perpetuity growth rate of 2%, COE of 11% and sector asset beta of 1 (all unchanged).
As we rollover our DCF model 1-year forward, we lift TP to EUR6.4/sh (from EUR6.2 previously), suggesting potential upside of 58%. We thus remain Overweight.
Adjusting for cash rich position, HELEX trades 10.0x 2016e PE (6.3x EV/EBITDA) at significant discounts vs peer group.
Given relatively low turnover velocity assumptions (46-53% in 2016e-17e), we see limited downside risk to our equity trading estimates.
Key risks
Tariff cuts of 20% in trading (to 1bp) and 25% in clearing (to 1.5bps) would trim EUR0.77 from our baseline valuation.
Market share losses of 5% to 30% (vs our 2016e daily trading turnover call of EUR100m) to rival platforms would cut EUR0.05 to EUR0.29 per share off our TP, respectively.
Post-trading loss of monopoly could trim EUR0.13 to EUR0.76 from HELEX fair value, assuming market share losses of 5% to 30% (vs our 2016e ADT call of EUR100m).
Potential pressure on equity prices and lower velocity should put HELEX earnings under strain.
Concentration risk as equity trading is largely banking sector oriented.
2016e-17e outlook
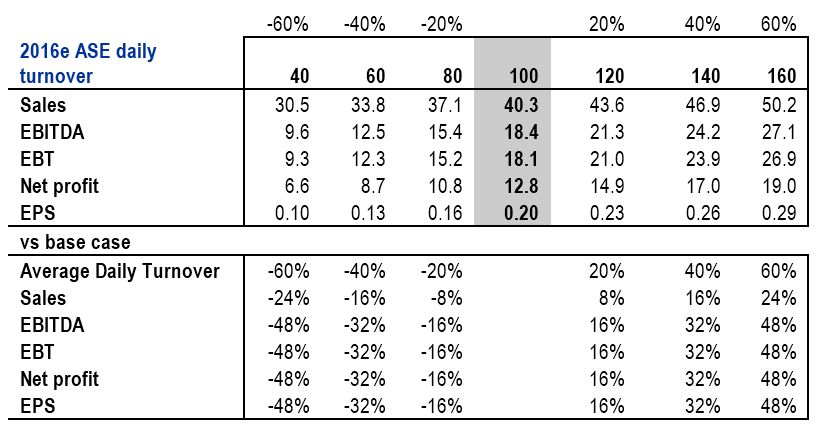
Our base case calls for daily turnover of EUR100m this year (vs EUR71 y-t-d) and EUR140m in 2017e, against EUR86m in 2015 and EUR127m in 2014.
On our estimates, equity transactions-related revenue (trading, clearing) should make up 40% of 2016e group total, up from 36% last year, rising to 47% and 49% over the next two years.
Tellingly, our 2016e-17e EUR100-140m volumes assumptions rest 71-79% below 2007 ASE's record high levels of EUR479m per day.
Upbeat equity trading revenues to act as key growth driver, +31% and 42% y-o-y in 2016e-17e to EUR16.3m and EUR23m vs 40% drop to EUR12.4m in 2015e, boosting net earnings 45% and 43% higher to EUR12.8m and EUR18.3m, respectively, albeit from a low base (-58% y-o-y to EUR8.8m in 2015e).